Description: The Inventory Turnover report shows the number of turns for a given inventory item over a 12 month period. This allows identification of situations where inventory is not providing an adequate return on investment. The following formula is used to calculate inventory turnover:
Cost of Goods Sold from Stock Sales During the Past 12 Months
Average Inventory Investment During the Past 12 Months
| Range | Description |
|---|---|
| Starting Part No. | |
| Ending Part No. | |
| Starting Classification | |
| Ending Classification | |
| Starting Category 1 | |
| Ending Category 1 | |
| Starting Category 2 | |
| Ending Category 2 | |
| Starting Category 3 | |
| Ending Category 3 | |
| Starting Category 4 | |
| Ending Category 4 | |
| Starting Category 5 | |
| Ending Category 5 | |
| Starting Physical Warehouse | |
| Ending Physical Warehouse | |
| Starting Logical Warehouse | |
| Ending Logical Warehouse | |
| As At Date | Inventory turns are calculated for the year ending on this date. |
| First Grouping | Physical Warehouse; Logical Warehouse; Classification; Category 1 -5; None
|
| Second Grouping | Physical Warehouse; Logical Warehouse; Classification; Category 1 -5; None |
| Third Grouping | Physical Warehouse; Logical Warehouse; Classification; Category 1 -5; None |
| Report Style | Summarised – Group headings and subtotals are shown, individual parts are not.
Detailed – All information is shown, including the individual part line. |
| Show 0 Value Movement Items | Use this setting to show (or hide) a part if it has had no sales and no receivals for the past 12 months (from the as at date). |
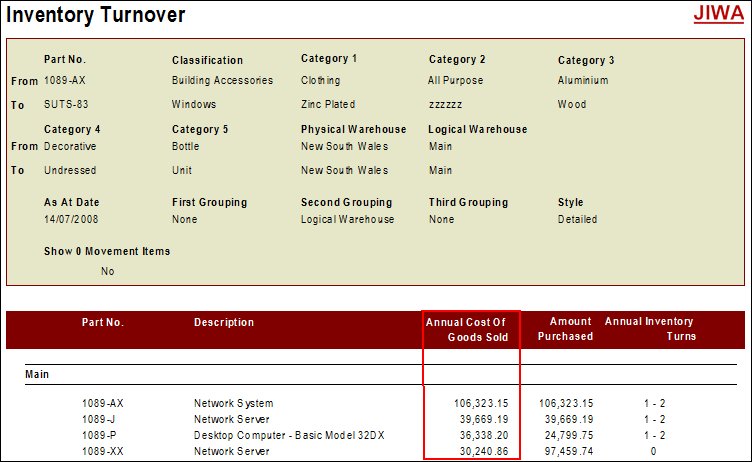
There are three important columns on the Inventory Turnover report that warrant explanation – “Annual Cost Of Goods Sold”, “Amount Purchased”, and “Annual Inventory Turns”.
This is used in the calculation of the “Annual Inventory Turns” figure, and is derived from SO_Sales.LineCost in the Jiwa database. Remember that only the sales for a given inventory item in the 12 months preceding the report’s As At Date are included in this figure.
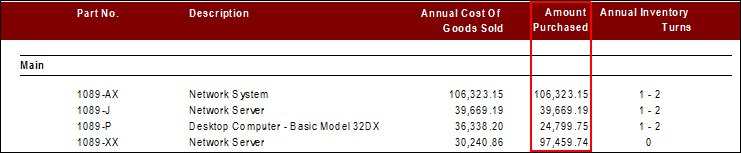
This is also used in the “Annual Inventory Turns” calculation. This figure represents the amount spent on purchasing stock, on a per inventory item basis. The figure is derived by multiplying IN_SOH.QuantityIn by IN_SOH.LCostIn from the Jiwa database. Like the “Annual Cost Of Goods Sold” figure above, the “Amount Purchased” figure is only for the past 12 months preceding the report’s As At Date.
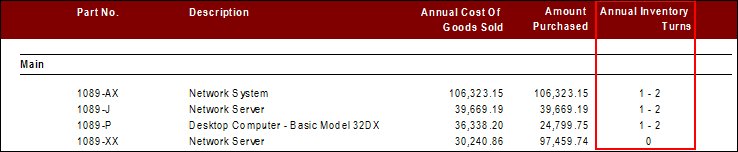
By dividing the aforementioned “Annual Cost Of Goods Sold” figure by the “Amount Purchased” figure, we arrive with a number that indicates how many times that inventory item has been sold equal to the amount of money invested in that item. This number is called the “inventory turnover rate” or “Annual Inventory Turns”.
This figure is provided as a range because turnover is calculated on the average inventory investment, not the amount purchased at one time.
The “Annual Inventory Turns” figure can be further used in the decision making process when deciding on which inventory items to stock, and what to set gross profit percentages at.
Copyright © 2012 Jiwa Financials. All rights reserved.